When stakeholder question about sample size?When stakeholder question about sample size? A good sample size (N): General answer is 10% of population or minimum 100. Sample example: Say, we would like to understand customer sentiment about our new cloud offering in US market and for that we first need to determine the total population or list of possible companies that will buy our offering. One way to look at this is to identify companies greater than 100 million USD. Based on US census (2013), here is the list
Answer: In order to understand this group (population) sentiment with accuracy we need 10% sample i.e. 258 (this is max) and min is 100 (Based on most statisticians.) How did we come up with this sample size? Below is an explanation Thumb rule:
Choose a number closer to the minimum sample size if:
Choose a number closer to the maximum same size if:
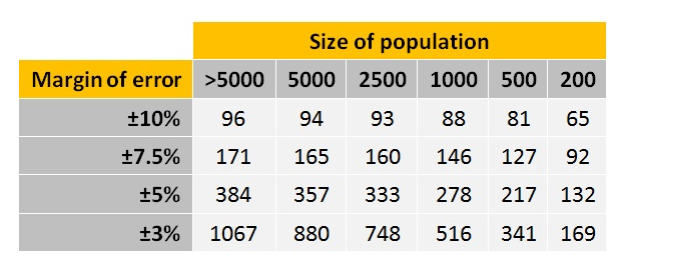 You will see on this table that the smallest samples are still around 100, and the biggest sample (for a population of more than 5000) is still around 1000. The same general principles apply as before – if you plan to divide the results into lots of sub-groups, or the decisions to be made are very important, you should pick a bigger sample.
0 Comments
Difference between Repeatability vs Reproducibility in simple terms:
RepeatabilityVariation that occurs when repeated measurements are made of the same item under absolutely identical conditions say, Same operator–Same setup–Same units–Same environmental conditions If there are variation due to Gage or device ReproducibilityVariation that results when different conditions are used to make the measurements say, :Different operators–Different setups–Different units–Different environmental conditions–Different measurement systems Variation due to operators For any business, customers is the final authority that determine the final value of any product or services with their decisions to buy or not. This decision are based on complex system of critical customer requirements. If you know how to decode those critical customer requirements you can make decision on business process with so much confidence. Say, as an example, I am planing to fly from Austin to Chicago with 2 bags. I will search for airline with criteria as low price and one that allow 2 bags. After searching, i figure out Southwest Airlines allow me to carry 2 bags at fair price which is close to nearby airlines. I decide that i will fly with Southwest airlines and buy the ticket. So of all the airlines, Southwest is winner ! Why Southwest in above example because of customer value. At same price i am getting more value. You can describe customer value in four areas: Cost, Quality, Features and Availability (CQFA). 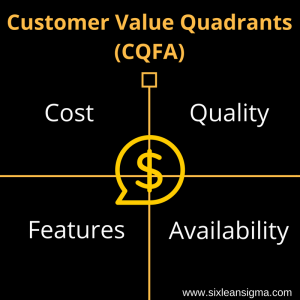 To prosper, a business process must do very well in at least one of those four area. Southwest win over feature as 2 Bag while prices are still same.
If a business can be best in class in one of those quadrants, they can thrive. But always, remember, level of the bar in each quadrant is rapidly changing, so always determine what is critical to your customer on continuous basis. I mean this technique is simple but u now, know what add value to customer. It’s CQFA. This is Part 1 of 3. I will soon publish part 2. In first part, we will actually understand what is agile project management, second, we will go with 5 steps of agile and next part we will decode this by using lean six sigma. Here you go:
Agile project management is very popular at all industry level. Around $80 -145 billion per year is spent on failed and cancelled projects (The Standish Group International, Inc.). 25% – 40% of all spending on projects is wasted as a result of re-work (Carnegie Mellon). 50% are rolled back out of production (Gartner). 40% of problems are found by end users (Gartner) poorly defined applications have led to a persistent miscommunication between business and IT. This contributes to a 66% project failure rate for these applications, costing U.S. businesses at least $30 billion every year (Forrester Research) (Reference 2) When we talk about billions of dollar as failure cost, industry answer to those are driven by Agile Management Philosophy. We will first start with overview of Agile Project Management. Basically, Agile Project Management is the process and with this process, we can manage and implement project in small pieces. In Software development lifecycle, a product consist of lot of feature. Feature? What is Feature? Let me explain you. I will start with a very basic example, Mobile Phone. In order, to design a mobile phone, we need Hardware and Software. Here, i will focus on software. For phone, what is software? It’s a combination of Messaging, Call, Internet, App, Wifi and so many. If we want to build a mobile software, then we need to develop every piece of software like messaging. For our example, developing a message software will be known as feature. Combining few feature say messaging, call, and internet will be name as Sprint or say bunch of feature combine together to make more sense. So, in short, we name particular software work as feature and combination of feature as Sprint. We can have multiple sprint for final delivery as a product. Every Sprint follow agile management methodology which are 5 step plan. A feature is similar to a requirement but instead focuses on a specific business need. We will explain 5 step in Part 2 Today, i am writing this blog about Net Promoter Score (NPS). Since 2003, NPS was adopted by many companies.
It determine customer loyality database which align with revenue. In Simple, if NPS is high, you are doing very good. If it’s low, then you need to analyze your score. It was introduced by Reichheld in his 2003 Harvard Business Review article “One Number You Need to Grow” NPS answer very simple question. ” How likely is it that you would recommend our company/product/service to a friend or colleague? The scoring for this answer is most often based on a 0 to 10 scale” Those who respond with a score of 9 -10 are called Promoters, and are considered likely to exhibit value-creating behaviors, such as buying more, remaining customers for longer, and making more positive referrals to other potential customers. Those who respond with a score of 0 to 6 are labeled Detractors, and they are believed to be less likely to exhibit the value-creating behaviors. Responses of 7 and 8 are labeled Passives, and their behavior falls in the middle of Promoters and Detractors. % of Promoter – % of Detractors = NPS NPS can be as low as −100 (everybody is a detractor) or as high as +100 (everybody is a promoter). An NPS that is positive (i.e., higher than zero) is felt to be good, and an NPS of +50 is excellent. Depending on your score, you can go in depth with root cause analysis why your NPS score is low or high. You can do root cause with technique as below: Traditional VOC (Voice of Customer) Collection Methods Interview Learn about a specific customer’s point of view on service issues, product/service attributes, and performance indicators/measures. Supports development of hypotheses about customer needs. Focus Group Organize information from the collective point of view of a group of customers that represent a segment. Helps clarify and define customer needs. Survey Measure the needs or the importance and performance of a product, service or attribute across an entire segment or group of segments. Furnishes quantitative data. Customer Complaint Data Collect and classify customer feedback about product performance, features and attributes –classify by type across product lines. Furnishes qualitative and quantitative data. Ethnographic VOC Collection Methods Ethnographic Interviews–Asking thought provoking questions –Actively listening to what the consumer is saying Observation–Carefully and non-judgmentally watching consumers as they go about their daily business (contextual inquiries)–Gleaning insights as you observe the things that they struggle with, are frustrated by, delighted in, and satisfied with Immersion–Stepping into another person’s life–Living that life for sufficient time to acquire insights Introspection–Imagining yourself in the role of the consumer–Living your life “in his/her shoes” Learn more from this page: Benchmark in simple word, how are you doing when you compare with your competitor.
It can be tricky to benchmark without proper sequence. It can distract you from one way to another. With a defined 5 step process, you can check yourself and improve your business as below: Try IT ! Benchmarking sequences •Determine Current Practices •Select problem area •Identify key performance factors •Understand your own processes and processes of others •Select performance criteria based on need and priorities •Identify Best Practices •Measure the performance within the organization •Determine the leader(s) in the criteria areas •Find an internal or external organization to benchmark with •Analyze Best Practices• Visit the organization as a benchmark partner•Collect information and data of benchmark leader•Evaluate and compare current practices with the benchmark•Note potential improvement areas •Model Best Practices•Drive improvement changes to advance performance levels•Extend performance breakthroughs within the organization•Incorporate the new information in business decision making•Share results with benchmark partner•Seek other benchmark leaders for further improvement Last month, i was searching for publication based on Lean Six Sigma. I had two thoughts in mind:
1. Read some good journal from trusted source. 2. How about, if i can write or submit article for this journal. After doing some research on google, i noticed, there is not a single blog which can narrate above mention points. Then, I decided to write one. In my search for journal, i dedicated 2 hour a day for a month. I went through lot of publication, company, text, ranking, article & content which cover topic based on lean six sigma. Finally, I have a list. If you have a unique topic from your experience, you can submit article in Journal. It’s simple & open source culture. Share your knowledge with other expert. Dedicated 1 hour a day and in month you will have a nice paper. Also, from reading perspective, you can follow this list with link: Enjoy !
This article, is independent analysis for Food Chain – Olive Garden.
Recently, i was reading one article about US food chain restaurant – Olive Garden that they increase revenue for same restaurant by 6.8% in a quarter. For a food chain business, it’s a bonus. For those who are not familiar with Olive Garden, it is restaurant based business where you can dine in -Italian food. First thing, we can learn about Oilve Garden from six sigma aspect is: “They are Delighters” (3rd type, Kano mode of six sigma). They go beyond satisfying customer need by serving an amazing salad with bread stick. Indeed, it is quality driven with taste. Next improvement, they did, lot of marketing for Carry out order. Their sales rose by 40% in 2 years. When a customer, dine in, you are telling him/her, we will give you price advantage if you order for today and carry out something for tomorrow. Again, they are breaking kano model to become delighters. Apart from that they introduce tablet on each table. Customer can order food and pay bill without wait. It’s super fast. On an average 7 minute time saving than before. A simple application of kano model can be game changer for your next business. Do more for your customer. They will gift you will increase in sales, QUARTERLYYYYYYYYYYYY Say, you own a business and your team or staff consist of 6-8 employee. Psychologically, they all are recruited for same job or different job but their behavior differ from one another in many ways. Example being, one employee is frank, he/she love to express himself/herself or any thought. Another employee being introvert, they do have thought but they may speak or may not. Other employee may be shy, thinking, what would other think about me. While some, may put pressure on other employee with their thought. Really.. Yeah, many different behavior. In order to eliminate this behavior difference, Nominal group technique (NGT) can be applied for idea generation, problem solution & initial interaction. Trick is simple. Just 5 step plan. Step 1: A facilitator or a person hosting the group can lead the discussion. He/She can presented a problem or goal require to achieve. Step 2: Before any discussion is held, all members create ideas silently and individually onto a sheet of paper for about 5 to 10 minutes Step 3: The facilitator then requests an idea from each member in sequence. Each idea is recorded until ideas are exhausted. No discussion is allowed at this point. Step 4: After the exhaustion of ideas, the clarification, support and evaluation of ideas is permitted. Comments on the ideas of others is encouraged Step 5: Then Final Stage, Voting for best solution is then conducted. Several rounds of voting may be needed before a ‘best’ idea is found. Yes, this is amazing technique to be more productive for problem solution or idea generation Below diagram will easy your brain with process. Enjoy ! 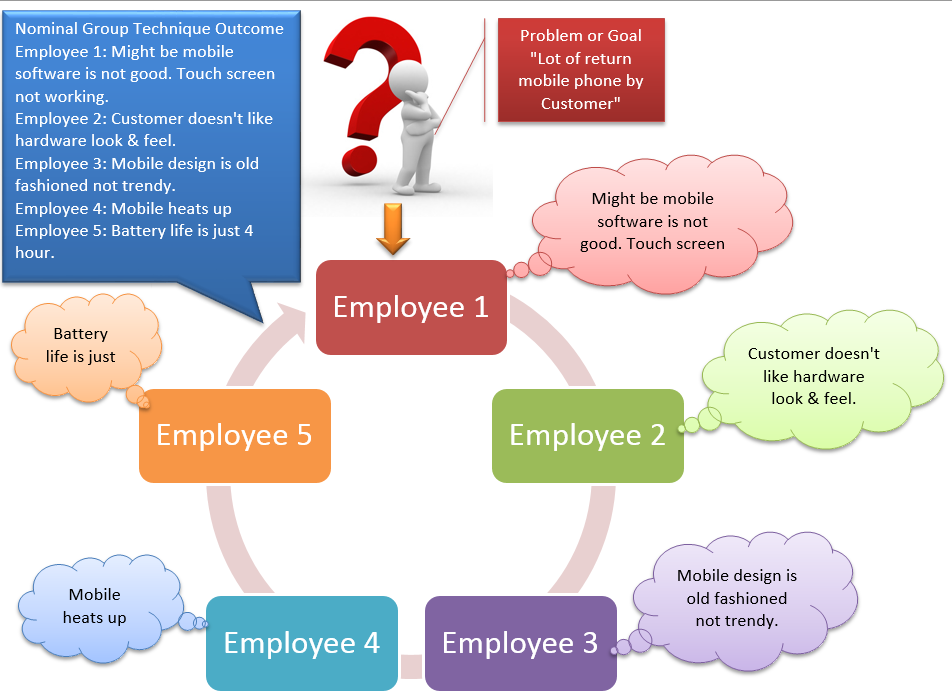 Force field analysis, this name sound so powerful as forces which can be positive or negative on anything. We can say positive is what we are looking for and negative is what we are trying to eliminate. That’s it, you are into concept of force field analysis. It is used for planning, problem identification and resolution Often in term of six sigma positive forces is known as “Driving Force” while negative forces is “Restraining Force”. Say, for a restaurant owner what will be positive forces? Guess… Hmmm.. More customer visiting restaurant, high sale from restaurant menu i.e. food, recommending to friend and visit us again. All positive. Right. Now, to same owner what will be negative forces affecting his/her plan? Simple, less customer visiting restaurant reason being bad ambiance, not that great food, terrible service, long wait time & not a single recommendation. This is all negative forces that a owner need to overcome. This can be feedback from survey, staff or customer. Question is “How he/she can understand force relationship in his/her desired goal?” Relationship between positive and negative force or relationship between Driving force and Restraining Force ? Once you know big picture, you can plan to achieve via tasks. One trick will be to write positive forces on left and negative forces on right. In center a summary of conclusion. Best will be to call, staff of restaurant which may be 4-6 people & ask them to list all the factor affecting goal thereby rating them. 1 being low concern and 5 being high. Below is example, check the big picture chart. You can apply same technique in your field. Forces can be endless just start listing them you will learn what will be the end plan. 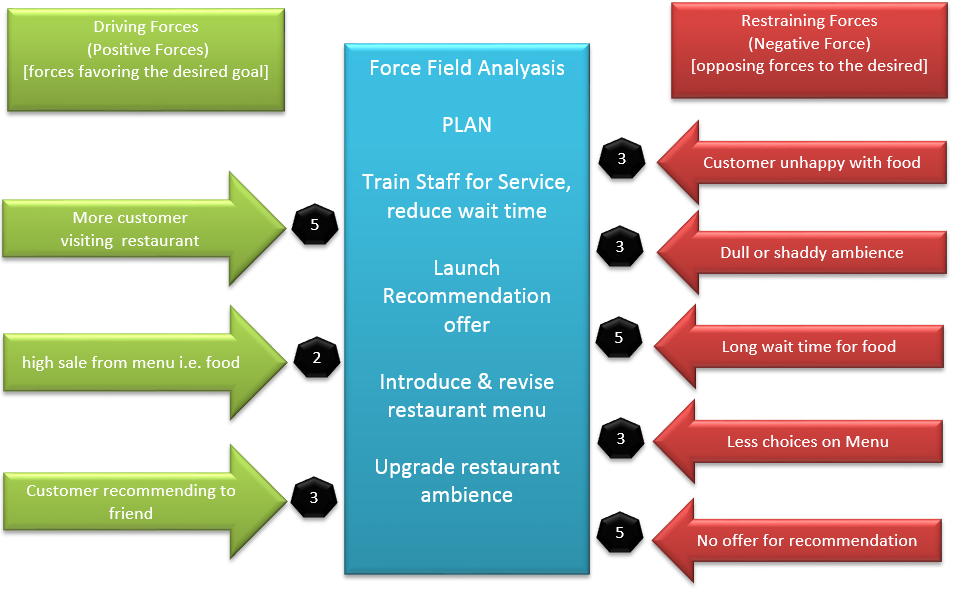 |
 RSS Feed