Lean Process Management , Excellence , Identification , Design & Mapping
Resource: Lean Process Management , Excellence , Identification , Design & Mapping, Cost ‐ Benefit Analysis Overview,
Lean Process Management
• Process Management Applications:
– Strategic Planning
– Continuous Improvement
– System and Process Design
• Benefits
– Method for Institutionalizing Continuous Improvement
– Strategy for Systems Integration
• Processes, People & Technology
– Solid approach for organizational & technology
– Enhancement
– Robust path to quality certifications
Why Bother with Process Excellence?
• For customer satisfaction
– highest quality products / services
– innovation in new products / services
• For profitability
– reduced expenses
• raw materials usage & waste
• safety & product liability
• For employee morale
– user friendly processes
‐‐‐>all translating into long‐term business success. Global competition demands nothing less.
Common Manufacturing Problems
• Low Throughput Efficiency
• Excessive production Leadtimes
• Excessive Work‐in‐process
• Late Orders
• Excessive Rework
• Poor Quality
• Chaos, Confusion, Lost Parts
• Excessive Production Cost
• Poor Customer Satisfaction
• Lost Orders (due to great market variety/ variability)
• Poor Safety Record
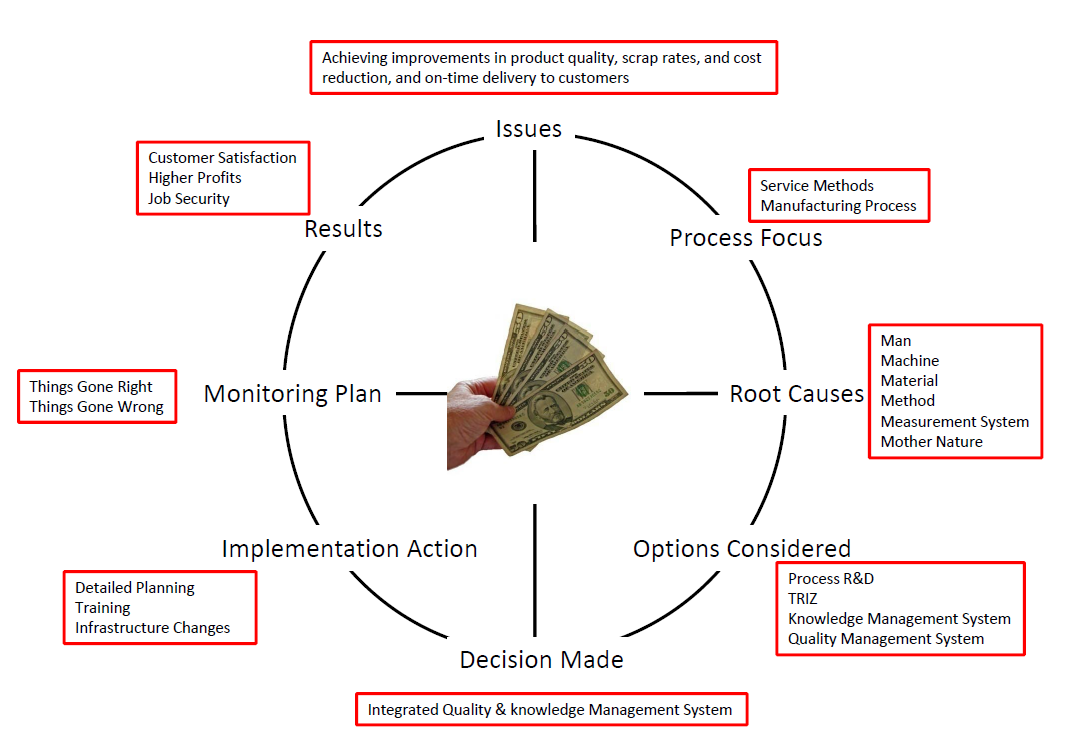
Process Identification & Mapping
• Understand the process, its objectives & resources used
Example:
Lean Process Management
• Process Management Applications:
– Strategic Planning
– Continuous Improvement
– System and Process Design
• Benefits
– Method for Institutionalizing Continuous Improvement
– Strategy for Systems Integration
• Processes, People & Technology
– Solid approach for organizational & technology
– Enhancement
– Robust path to quality certifications
Why Bother with Process Excellence?
• For customer satisfaction
– highest quality products / services
– innovation in new products / services
• For profitability
– reduced expenses
• raw materials usage & waste
• safety & product liability
• For employee morale
– user friendly processes
‐‐‐>all translating into long‐term business success. Global competition demands nothing less.
Common Manufacturing Problems
• Low Throughput Efficiency
• Excessive production Leadtimes
• Excessive Work‐in‐process
• Late Orders
• Excessive Rework
• Poor Quality
• Chaos, Confusion, Lost Parts
• Excessive Production Cost
• Poor Customer Satisfaction
• Lost Orders (due to great market variety/ variability)
• Poor Safety Record
Process Identification & Mapping
• Understand the process, its objectives & resources used
Example:
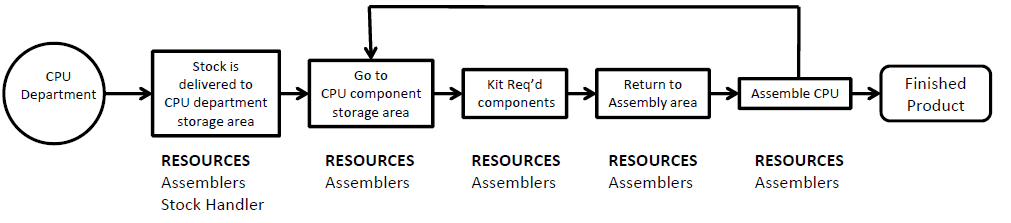
Process Description: Assemblers complete an assembly, then go to the stock area where they gather the necessary parts for the kit. They return to the assembly area and proceed with the assembly work. A Part Handler ensures that the kit pull area always has a sufficient quantity of components.
Process Mapping Method
• 5 Q’s
– WHAT: Kit Parts, Assemble Parts
– HOW: Kit‐> Put required parts in tray, Travel‐>Take tray to assembly area, Assembly‐>Assemble parts in proper order
– WHEN: Kit first, Assemble second, Repeat
– WHO: Assembler kits & assembles parts
– WHERE: Kiting in part storage area, Assembly in assembly area.
Process Diagnosis Identify Root Causes
BRAINSTORM POSSIBLE CAUSES
– Stock handling ( insufficient supply when needed)
– Not enough Assemblers
– Assembly procedures
– Training
– Distance between stock and assembly areas
– Inefficient use of assembly resources
Implications:
• list of issues / symptoms of poor performance: excessive overtime.
• performance metrics/ criteria/ factors: throughput, overtime hours.
• cause of each problem: inefficient organization of the process steps (METHODS & APPROACHES).
BRAINSTORM POSSIBLE CAUSES
– Add enough stock handlers to keep assemblers supplied with kits
– Add a stock handler and a couple of Kit Racks, each capable of holding 30 Kits
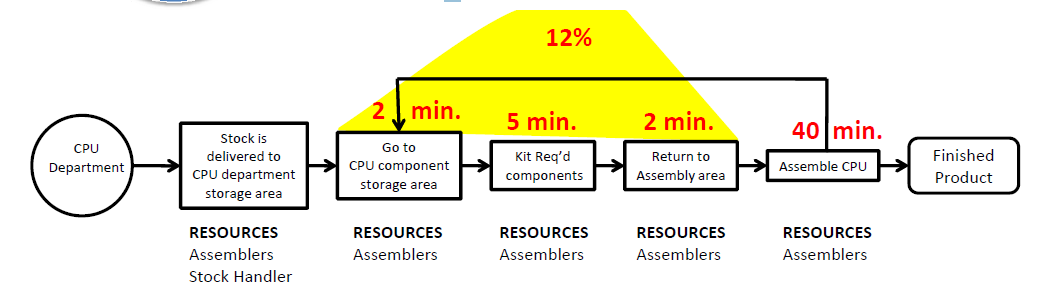
Process Design
• brainstorm solution options
• evaluate (simulate) process alternatives
• make decision to select a preferred alternative
• Create a simulation model of each alternative
– Current system
– Proposed system
• Run each simulation model & collect data on each
– Hours needed to make the required production
• 2000 parts per week is desired
– $ per part (while in CPU department)
• Use Appropriate Decision Making Tools
– Cost / Benefit Analysis
Cost ‐ Benefit Analysis Overview
• 12 STEP PROCESS:
1. Establish the Problem Statement: Determine which of the two alternatives will produce the best out come using the simulation output data and management supplied measurement criteria, relative importance weighting, and benchmark data.
2. Determine Criteria
3. List Alternatives
4. List Analysis Factors
5. List Assumptions
6. Assign Scores
7. Collate Scores
8. Analyze Alternatives
9. Analyze Results
10. Make Decision
11. Perform What‐Ifs: – Change different assumptions to determine if the decision is ROBUST.
– What ‐ If results may indicate:
• the choice is clear ‐‐ no reason to be nervous
• a need for more detailed analysis
– zoom ‐ in on one or more factors
– incorporate additional factors in the analysis
– use qualitative factors to capture issues of human judgment
• a need for more data, to minimize uncertainty
• a need to hedge, or buy “insurance”
12. Explain Why…..
Then, . . . Document the Study
Process Focused Strategic Planning
• list of issues / symptoms of poor performance: excessive overtime.
• performance metrics/ criteria/ factors: throughput, overtime hours.
• cause of each problem: inefficient organization of the process steps (METHODS & APPROACHES).
BRAINSTORM POSSIBLE CAUSES
– Add enough stock handlers to keep assemblers supplied with kits
– Add a stock handler and a couple of Kit Racks, each capable of holding 30 Kits
Process Design
• brainstorm solution options
• evaluate (simulate) process alternatives
• make decision to select a preferred alternative
• Create a simulation model of each alternative
– Current system
– Proposed system
• Run each simulation model & collect data on each
– Hours needed to make the required production
• 2000 parts per week is desired
– $ per part (while in CPU department)
• Use Appropriate Decision Making Tools
– Cost / Benefit Analysis
Cost ‐ Benefit Analysis Overview
• 12 STEP PROCESS:
1. Establish the Problem Statement: Determine which of the two alternatives will produce the best out come using the simulation output data and management supplied measurement criteria, relative importance weighting, and benchmark data.
2. Determine Criteria
3. List Alternatives
4. List Analysis Factors
5. List Assumptions
6. Assign Scores
7. Collate Scores
8. Analyze Alternatives
9. Analyze Results
10. Make Decision
11. Perform What‐Ifs: – Change different assumptions to determine if the decision is ROBUST.
– What ‐ If results may indicate:
• the choice is clear ‐‐ no reason to be nervous
• a need for more detailed analysis
– zoom ‐ in on one or more factors
– incorporate additional factors in the analysis
– use qualitative factors to capture issues of human judgment
• a need for more data, to minimize uncertainty
• a need to hedge, or buy “insurance”
12. Explain Why…..
Then, . . . Document the Study
Process Focused Strategic Planning