Six Sigma Analyze : 4 Analysis of Variance (ANOVA)
ANOVA What is a factor? The 1-way ANOVA The 2-way or 3-way ANOVA Definition of “Treatment” Bartlett’s Test Purpose Factor Level P-value ≤ α: reject null hypothesis.
The Analysis of Variance (ANOVA)
The ANOVA procedure is one of the most powerful statistical techniques. ANOVA is a general technique that can be used to test the hypothesis that the means among two or more groups are equal, under the assumption that the sampled populations are normally distributed.
To begin, let us study the effect of temperature on a passive component such as a resistor. We select three different temperatures and observe their effect on the resistors. This experiment can be conducted by measuring all the participating resistors before placing n resistors each in three different ovens.
Each oven is heated to a selected temperature. Then we measure the resistors again after, say, 24 hours and analyze the responses, which are the differences between before and after being subjected to the temperatures. The temperature is called a factor. The different temperature settings are called levels. In this example there are three levels or settings of the factor Temperature.
What is a factor?
A factor is an independent treatment variable whose settings (values) are controlled and varied by the experimenter.
The intensity settingof a factor is the level. Levels may be quantitative numbers or, in many cases, simply “present” or “not present” (“0” or “1”).
For example, the temperature setting in the resistor experiment may be:
100 F, 200F and 300F
We can simply call them:
Level 1; Level 2 and Level 3
The 1-way ANOVA
In the experiment above, there is only one factor, temperature, and the analysis of variance that we will be using to analyze the effectof temperature is called a one-wayor one-factor ANOVA.
The 2-way or 3-way ANOVA
We could have opted to also study the effect of positions in theoven. In this case there would be two factors, temperature and oven position. Here we speak of a two-wayor two-factor ANOVA. Furthermore, we may be interested in a third factor, the effect of time. Now we deal with a three-wayor three-factorANOVA. In each of these ANOVA’s we test a variety of hypotheses of equality of means (or average responses when the factors are varied).
One-Way ANOVA
Unlike two sample test, we are dealing with multiple samples. One-way ANOVA compares and tests for 3 or more groups. We also call ‘techniques’in example 9 a ‘Factor’, and this factor has 4 ‘levels’. The measurement data in Example 9 is usually called ‘output’or ‘response’.
To determine whether any of the differences between the means are statistically significant, compare the p-value to your significance level to assess the null hypothesis. The null hypothesis states that the population means are all equal. Usually, a significance level (denoted as α or alpha) of 0.05 works well. A significance level of 0.05 indicates a 5% risk of concluding that a difference exists when there is no actual difference.
P-value ≤ α: The differences between some of the means are statistically significant. If the p-value is less than or equal to the significance level, you reject the null hypothesis and conclude that not all of population means are equal. Use your specialized knowledge to determine whether the differences are practically significant.
P-value > α: The differences between the means are not statistically significant If the p-value is greater than the significance level, you do not have enough evidence to reject the null hypothesis that the population means are all equal. Verify that your test has enough power to detect a difference that is practically significant.Example 1:The tensile strength of Portland cement is being studied. Four different mixing techniques are compared as follows with tensile strength Testing results:
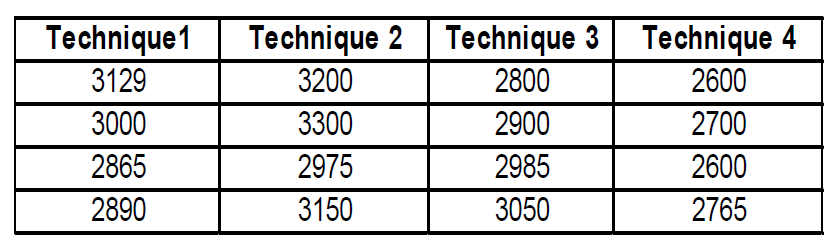
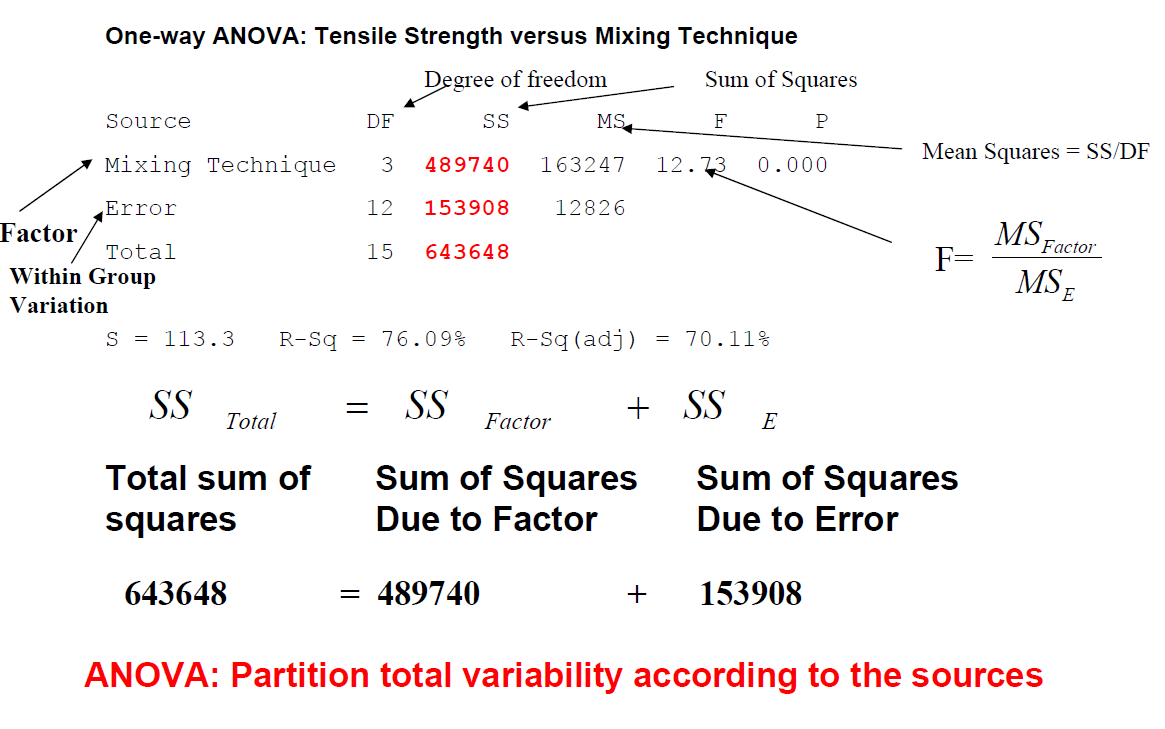
In these results, the null hypothesis states that the tensile stength values of 3 different technique are equal. Because the p-value is 0.000, which is less than the significance level of 0.05, you can reject the null hypothesis and conclude that some of the technique have different tensile strength. .
Definition of “Treatment”
We introduced the concepts of treatment.The definition is: A treatment is a specific combination of factor levels whose effect is to be compared with other treatments.
What does ANOVA do?
ANOVA tests the following hypotheses:
H0: The means of all the groups are equal.
H1: Not all the means are equal
•doesn’t say how or which ones differ.
•Can follow up with “multiple comparisons”
Bartlett’s Test Purpose:
Test for Homogeneity of Variances Bartlett’s test is used to test if k samples have equal variances. Equal variances across samples is called homogeneity of variances. Some statistical tests, for example the analysis of variance, assume that variances are equal across groups or samples. The Bartlett test can be used to verify that assumption.
Bartlett’s test is sensitive to departures from normality. That is, if your samples come from non-normal distributions, then Bartlett’s test may simply be testing for non-normality. The Levenetestis an alternative to the Bartlett test that is less sensitive to departures from normality.