Six Sigma: Improve Phase : 1 About Design of experiments (DOE)
What is Experimental Design? DOE is an Improvement Tool . How DOE Works? Benefits of Experiments What are the DOE objectives? Comparative designs Screening designs Response Surface modeling Regression modeling Strategy for Experimentation
DOE is an Improvement Tool . It answer some of important questions like:
-Which factors have the strongest effects?
-Do any of the factors interact?
-Which factor settings give the best results?
What is Experimental Design?
Organizing the way in which one changes one or more input variables (Xs) to see if any of the variables, or any combination of those variables, affects the output (Y) in a significant way.
In an experiment, we deliberately change one or more process variables (or factors) in order to observe the effect the changes have on one or more response variables. The (statistical) design of experiments (DOE) is an efficient procedure for planning experiments so that the data obtained can be analyzed to yield valid and objective conclusions.DOE begins with determining the objectivesof an experiment and selecting the process factorsfor the study. An Experimental Design is the laying out of a detailed experimental plan in advance of doing the experiment. Well chosen experimental designs maximize the amountof “information” that can be obtained for a given amount of experimental effort.The statistical theory underlying DOE generally begins with the concept of process models.
How DOE Works?
-Purposeful and systematic changes in the inputs (factors) in order to observe corresponding changes in the output (response)
-Figure out the relationship between factors and responses by experimental data analysis
-Determine the factors setting for best results in responses
Benefits of Experiments
Statistical experiments are rich in benefits:
•Short time to get results
•Relatively low cost
•Excellent chance of detecting optimal variable levels
•Very high confidence in results
•Able to identify independent main and interaction effects
What are the DOE objectives?
Comparative designs to:
-choose between alternatives, with narrow scope, suitable for an initial comparison
-choose between alternatives, with broad scope, suitable for a confirmatory comparison
Screening designs
to identify which factors/effects are important
when you have 2 -4 factors and can perform a full factorial
when you have more than 3 factors and want to begin with as small a design as possible
when you have some qualitative factors, or you have some quantitative factors that are known to have a non-monotonic effect
Response Surface modeling
to achieve one or more of the following objectives:
hit a target
maximize or minimize a response
reduce variation by locating a region where the process is easier to manage
make a process robust
Regression modeling
to estimate a precise model, quantifying the dependence of response variable(s) on process inputs.
Strategy for Experimentation
Experimentation steps:
•Select the Response Variable(s) –Y
•Select the Independent Factor(s) –X
•Choose the Factor Levels•Select the Experimental Design
•Collect the Data
•Analyze the Data
•Draw Conclusions
•Apply Optimal Factor Settings
Process Models for DOE
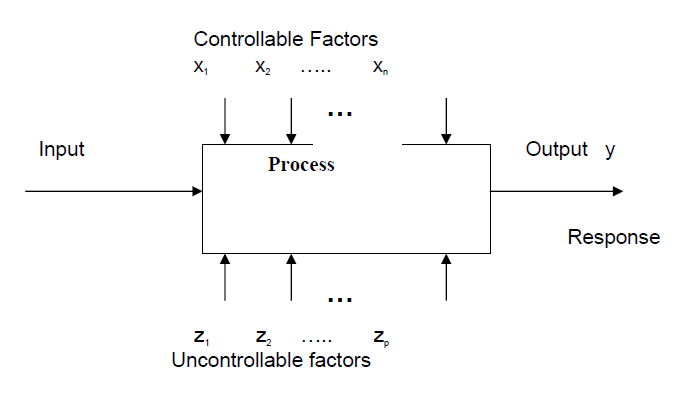
It is common to begin with a process model of the `black box’ type, with several discrete or continuous input factors that can be controlled–that is, varied at will by the experimenter–and one or more measured output responses. The output responses are assumed continuous. Experimental data are used to derive an empirical (approximation) model linking the outputs and inputs. These empirical models generally contain first and second-order terms. Often the experiment has to account for a number of uncontrolled factors that may be discrete, such as different machines or operators, and/or continuous such as ambient temperature or humidity