SixLeanSigma.com
  • Home
  • Six Sigma Wiki
    • History of Six Sigma : The Guru’s
    • Lean vs Six Sigma
    • What is Six Sigma ? Objectives Fundamental Beliefs Benefits
    • Six Sigma Project Overview >
      • Six Sigma Process Performance Metrics
      • Project Execution : Selection , Flowchart , Management , Evaluation
      • Voice of the Customer (VOC) >
        • CTX (Critical to X) Quality
        • Kano Model
        • Different type of Quality Cost
      • Risk Analysis SWOT (Strength, Weakness, Opportunity, Threat)
    • Six Sigma Team Management : Types, Roles, Size, Stages & Life cycle >
      • Six Sigma Organizational Infrastructure Team Leadership >
        • Six Sigma Roles and owners process
        • 3 levels of business management process
        • Six Sigma Training: Black vs Green Belt
        • Overview of DMAIC : Key points
      • Six Sigma Team Tool: Facilitation & Groupthink
      • Nominal Group Techniques Multivoting Force Field Analysis Brainstorming
      • Diagrams : Affinity Tree PDPC Matrix Interrelationship Prioritization matrices Activity network diagram
      • The 4 Stages of Team Growth & Human factor: Forming, Storming, Norming, and Performing
    • Six Sigma: Define Phase : Outcomes & 6 Element >
      • Six Sigma Define: 1Define Problem & 2 Identify Customer
      • Six Sigma : Define : 3 : Identify CTQs ( VOC Kano Model )
      • Six Sigma : Define : 4 : Map Process 5 Refine Project Scope
      • Six Sigma : Define : 6 Update Project Charter ( PERT CPM Gantt Bar WBS)
    • Six Sigma: Measure Phase : Outcomes & 5 Element >
      • Six Sigma: Measure : 1 Identify Measurement and Variation
      • Six Sigma: Measure : 2 Determine Data Type
      • Six Sigma: Measure : 3 Develop Data Collection Plan
      • Six Sigma: Measure : 4 Measurement System Analysis & Data Collection
      • Six Sigma: Measure : 5 Perform Capability Analysis
    • Six Sigma: Analyze Phase : Outcomes & 4 Element >
      • Six Sigma Analyze : 1 Measuring and modeling the relationship between Variables
      • Six Sigma Analyze : 2 Hypothesis Testing
      • Six Sigma Analyze : 3 Failure mode and effects analysis (FMEA)
      • Six Sigma Analyze : 4 Analysis of Variance (ANOVA)
    • Six Sigma: Improve Phase : Overview & 6 Element >
      • Six Sigma: Improve Phase : 1 About Design of experiments (DOE)
      • Six Sigma: Improve Phase : 2 DOE Process variables & Analysis
      • Six Sigma: Improve Phase : 3 Design Selection Guideline
      • Six Sigma: Improve Phase : 4 : Lean 5S
      • Six Sigma: Improve Phase : 5 Poke Yoke
      • Six Sigma: Improve Phase : 6 Standard Work & Kaizen
    • Six Sigma: Control Phase : Overview & 3 Element >
      • Six Sigma: Control Phase : 1. Statistical Process Control
      • Six Sigma: Control Phase : 2. Control Chart
      • Six Sigma: Control Phase : 3. Other: Pre-control Technique, TPM & Visual Management
  • Lean Wiki
    • History of Lean & Guru’s >
      • Birth of Lean
    • About Lean, Value, Waste, Muda, Mura & Muri >
      • Overview Lean Tools, Techniques & House of Lean
      • Lean Excellence, Tools & Framework
      • Lean Framework 6 points, metric & Stability
    • Lean Team Setup : Structure, Meeting & Project >
      • Self Directed Work Teams (SDWT) , ACHIEVE TEAM SYNERGY , SQDCM, Teamwork Principles, Team Structure & Team Leader
      • The 4 Stages of Team Growth & Human factor: Forming, Storming, Norming, and Performing
    • Lean Process Mapping: Generic & Type >
      • SIPOC: Suppliers, Input, Process, Output & Customers
      • Lean Process Management , Excellence , Identification , Design & Mapping
      • Lean Process Mapping Symbols
      • How to Create a Simple Process Flow Diagram
      • Lean Value Stream Mapping, current, future & 3 type of work
      • Value Stream Mapping (VSM): About & 17 steps
      • Other Types of Process Maps & Pitfalls: Resources: iDef0, Document Map, Work Diagrams, Rendered Process Map
    • Lean Process Optimization , Andon System , Error Proofing ( Poka Yoke ) & Defect vs Errors >
      • Lean 5S System
      • Kanban : Benefits, Shapes of Inventory, Type, Operation & Sizing
      • Cellular Manufacturing: About, Benefits & 4 Dimensions of Cells
      • Heijunka, A 3 Thinking, Hoshin planning, Jidoka, Poka‐yoke , Kanban, Takt , Kaizen
      • Lean Kaizen (continuous improvement), Systems Thinking & Process Variability
      • Lean Visual Management & Visual Control
      • Lean Waste Detail: Eight Types of Waste
      • Line Balancing, Cycle Time, Takt Time, Assembly / Workload Balance & Man – Machine – Setup – Time
      • Single Piece Flow, Continuous Flow & Standardized Work
      • SMED Single Minute Exchange of Dies
      • Total Productive Maintenance (TPM): Preventive Maintenance Corrective Maintenance Inbuilt Maintenance
  • Blog
  • Contact

Six Sigma : Define : 4 : Map Process 5 Refine Project Scope

Benefits of Process Pareto Diagrams Mapping SIPOC  Definition of Project Scope 
4 : Map ProcessBenefits of Process Mapping
•Provides a visual representation of the process
•Allows flexibility in levels
•Demands verification and objectivity–Hands-on exposure to local activities
•Identifies rework loops and redundancies
•Gives insight into bottlenecks, cycle times and inventory•Serves as a training and orientation tool
•Identifies non-value added steps
•Helps identify when and where to collect data•Identifies where different work teams use different processes
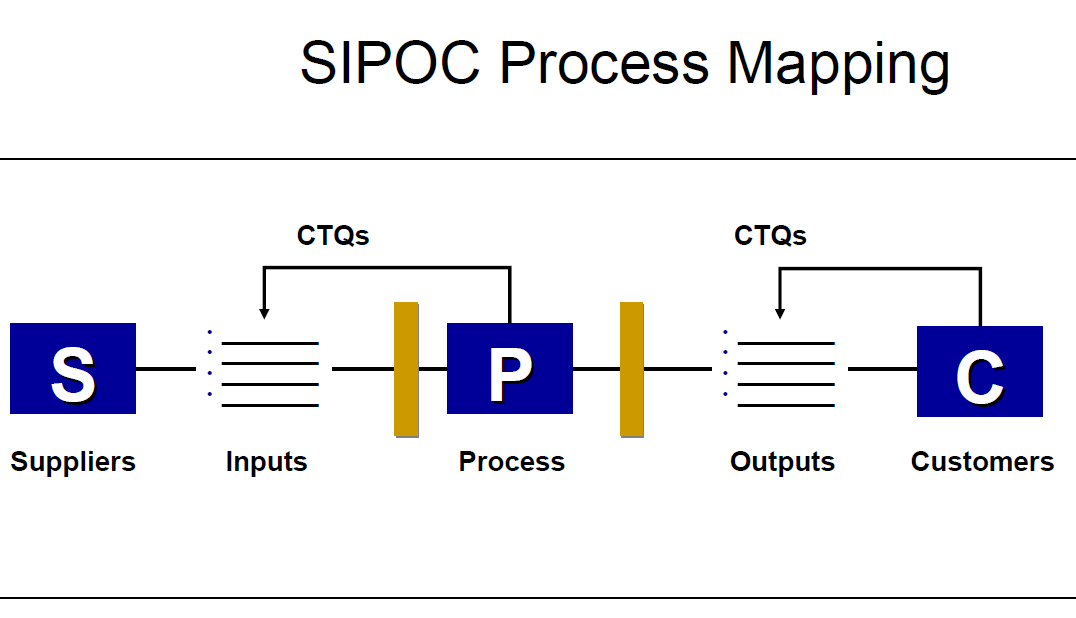
SIPOC process map is designed to be high level process view with4-7 steps displayed
Simon suggests the following steps for the developing of a SIPOC diagram:
1.Have the team create the process map. A meeting room with wall space can be used to display the process steps. Cards can be used to map out the process before finalizing a map
2. The process may have four to five key steps. How is the raw material or product transformed?
3. List the outputs of the process. What is the end result, product/service of this process?
4. List the customers of the output of the process. Who is the user of the end result of the process?
5. List the inputs of the process. Where do the materials come from?
6. List the suppliers of the process. Who are the key suppliers?7. As an optional step, identify some preliminary requirements of the customers.
8. Involve the team leader, champion, and other stakeholders for verification of the project.
Here is how you can do it:


5 Refine Project ScopeDefinition of Project Scope
Project scope is the extent to which variables or factors will be measured and analyzed, in order to target specific areas for process improvements.
Pareto Diagrams
Pareto diagrams are very specialized forms of column graphs. They are used to prioritize problems ( Or opportunities) so that the major problems (or opportunities) can be identified. Pareto diagram can help Six Sigma teams get a clear picture of where the greatest contribution can be made.
Pareto diagrams are used to
•Analyze a problem from a new perspective
•Focus attention on problems in priority order
•Compare data changes during different time periods
•Provide a basis for the construction of a cumulative line
Picture
All content reserved by SixLeanSigma.com​.  
  • Home
  • Six Sigma Wiki
    • History of Six Sigma : The Guru’s
    • Lean vs Six Sigma
    • What is Six Sigma ? Objectives Fundamental Beliefs Benefits
    • Six Sigma Project Overview >
      • Six Sigma Process Performance Metrics
      • Project Execution : Selection , Flowchart , Management , Evaluation
      • Voice of the Customer (VOC) >
        • CTX (Critical to X) Quality
        • Kano Model
        • Different type of Quality Cost
      • Risk Analysis SWOT (Strength, Weakness, Opportunity, Threat)
    • Six Sigma Team Management : Types, Roles, Size, Stages & Life cycle >
      • Six Sigma Organizational Infrastructure Team Leadership >
        • Six Sigma Roles and owners process
        • 3 levels of business management process
        • Six Sigma Training: Black vs Green Belt
        • Overview of DMAIC : Key points
      • Six Sigma Team Tool: Facilitation & Groupthink
      • Nominal Group Techniques Multivoting Force Field Analysis Brainstorming
      • Diagrams : Affinity Tree PDPC Matrix Interrelationship Prioritization matrices Activity network diagram
      • The 4 Stages of Team Growth & Human factor: Forming, Storming, Norming, and Performing
    • Six Sigma: Define Phase : Outcomes & 6 Element >
      • Six Sigma Define: 1Define Problem & 2 Identify Customer
      • Six Sigma : Define : 3 : Identify CTQs ( VOC Kano Model )
      • Six Sigma : Define : 4 : Map Process 5 Refine Project Scope
      • Six Sigma : Define : 6 Update Project Charter ( PERT CPM Gantt Bar WBS)
    • Six Sigma: Measure Phase : Outcomes & 5 Element >
      • Six Sigma: Measure : 1 Identify Measurement and Variation
      • Six Sigma: Measure : 2 Determine Data Type
      • Six Sigma: Measure : 3 Develop Data Collection Plan
      • Six Sigma: Measure : 4 Measurement System Analysis & Data Collection
      • Six Sigma: Measure : 5 Perform Capability Analysis
    • Six Sigma: Analyze Phase : Outcomes & 4 Element >
      • Six Sigma Analyze : 1 Measuring and modeling the relationship between Variables
      • Six Sigma Analyze : 2 Hypothesis Testing
      • Six Sigma Analyze : 3 Failure mode and effects analysis (FMEA)
      • Six Sigma Analyze : 4 Analysis of Variance (ANOVA)
    • Six Sigma: Improve Phase : Overview & 6 Element >
      • Six Sigma: Improve Phase : 1 About Design of experiments (DOE)
      • Six Sigma: Improve Phase : 2 DOE Process variables & Analysis
      • Six Sigma: Improve Phase : 3 Design Selection Guideline
      • Six Sigma: Improve Phase : 4 : Lean 5S
      • Six Sigma: Improve Phase : 5 Poke Yoke
      • Six Sigma: Improve Phase : 6 Standard Work & Kaizen
    • Six Sigma: Control Phase : Overview & 3 Element >
      • Six Sigma: Control Phase : 1. Statistical Process Control
      • Six Sigma: Control Phase : 2. Control Chart
      • Six Sigma: Control Phase : 3. Other: Pre-control Technique, TPM & Visual Management
  • Lean Wiki
    • History of Lean & Guru’s >
      • Birth of Lean
    • About Lean, Value, Waste, Muda, Mura & Muri >
      • Overview Lean Tools, Techniques & House of Lean
      • Lean Excellence, Tools & Framework
      • Lean Framework 6 points, metric & Stability
    • Lean Team Setup : Structure, Meeting & Project >
      • Self Directed Work Teams (SDWT) , ACHIEVE TEAM SYNERGY , SQDCM, Teamwork Principles, Team Structure & Team Leader
      • The 4 Stages of Team Growth & Human factor: Forming, Storming, Norming, and Performing
    • Lean Process Mapping: Generic & Type >
      • SIPOC: Suppliers, Input, Process, Output & Customers
      • Lean Process Management , Excellence , Identification , Design & Mapping
      • Lean Process Mapping Symbols
      • How to Create a Simple Process Flow Diagram
      • Lean Value Stream Mapping, current, future & 3 type of work
      • Value Stream Mapping (VSM): About & 17 steps
      • Other Types of Process Maps & Pitfalls: Resources: iDef0, Document Map, Work Diagrams, Rendered Process Map
    • Lean Process Optimization , Andon System , Error Proofing ( Poka Yoke ) & Defect vs Errors >
      • Lean 5S System
      • Kanban : Benefits, Shapes of Inventory, Type, Operation & Sizing
      • Cellular Manufacturing: About, Benefits & 4 Dimensions of Cells
      • Heijunka, A 3 Thinking, Hoshin planning, Jidoka, Poka‐yoke , Kanban, Takt , Kaizen
      • Lean Kaizen (continuous improvement), Systems Thinking & Process Variability
      • Lean Visual Management & Visual Control
      • Lean Waste Detail: Eight Types of Waste
      • Line Balancing, Cycle Time, Takt Time, Assembly / Workload Balance & Man – Machine – Setup – Time
      • Single Piece Flow, Continuous Flow & Standardized Work
      • SMED Single Minute Exchange of Dies
      • Total Productive Maintenance (TPM): Preventive Maintenance Corrective Maintenance Inbuilt Maintenance
  • Blog
  • Contact