Six Sigma: Measure : 2 Determine Data Type
Two Types of Variation Types of Data Attribute Data Variables Data Locational Data Collecting and Summarizing Data Measurement Usage Why Measure? All Processes Have Variation Sources of Variation Measurement Scales Nominal Ordinal (Ranking) Interval Ratio
Collecting and Summarizing Data
Collecting and summarizing data is described in the following topics:
•Types of data
•Measurement scales
•Methods for collecting data
•Techniques for assuring data accuracy and integrity
•Descriptive statistics
•Graphical methods
Measurement Usage
Measurements can be made of the inputs to the process, the process itself, or the outputs of the process.
Why Measure?
•Measurement allows Teams to …
–Establish baseline process performance
–Isolate sources of variation
–Identify areas where improvements can be made
All Processes Have Variation
•All repetitive activities of a process have a certain amount of fluctuation
•Input, process, and output measures also fluctuate
•This fluctuation is called variation
Sources of Variation
Machines
Materials
Methods
Measurement
Mother Nature
People
Two Types of Variation
1. Common Causes: No undue influence by any one of the 5Ms and 1P
Characteristics : Expected Predictable Normal
2. Special cause : Undue influence by at least one of the 5Ms and 1P
Characteristics: Unexpected Unpredictable Not normal
Types of Data
Data is objective information that everyone can agree on. Measurability is important in collecting data. The three types of data are attribute data, variables data and locationaldata. Of these three, attribute and variables data are more widely used.
Attribute Data
Attribute data is discrete. This means that the data values can only be integers, for example, 3, 48, 1029. Counted data or attribute data are answers to questions like “how many”, “how often” or “what kind.” Examples include: . How many of the final products are defective? . How often are the machines repaired? . How many people are absent each day? . How many days did it rain last month? . What kind of performance was achieved?
Variables Data
Variables data is continuous. This means that the data values can be any real number, for example, 1.037, -4.69, 84.35. Measured data (variables data) are answers to questions like “how long,” “what volume,” “how much time” and “how far.” This data is generally measured with some instrument or device. Examples include: . How long is each item? . How long did it take to complete the task? . What is the weight of the product? Measured data is regarded as being better than counted data. It is more precise and contains more information. For example, one would certainly knowmuch more about the climate of an area if they knew how much it rained each day rather than how many days it rained. Collecting measured data is often difficult or expensive, so we must often rely on counted data. In some situations, data will only occur as counted data. For example, a food producer may measure the performance of microwave popcorn by counting thenumber of kernels of unpoppedcorn in each bag tested. For information which can be obtained as either attribute or variables data, it is generally preferable to collect variables data.
Examples of Data Types
•Attribute Data
–Categories
–Yes/No
–Go/No Go
–Pass/Fail
–Good/Defective
•Variable Data
–Continuous Data
•Decimal places show absolute distance between numbers
–Time
–Finance Charges
–Length
–Width
Locational Data
The third type of data, does not fit into either category above.This data is known as locationaldata which simply answers the question “where.” Charts that utilize locationaldata are often called “measles charts” or concentration charts. Examples are a drawing showing locations of paint blemishes on an automobile or a map of the United States with sales and distribution offices indicated.
Conversion of Attributes Data to Variables
Measures Some data may only have discrete values, such as this part is good or bad, or I like or dislike the quality of this product. Since variables data provides more information than does attributes data, for a given sample size, it is desirable to use variables data whenever possible.
When collecting data, there are opportunities for some types of data to be either attributes or variables. Instead of a good or bad part, the data can be statedas to how far out of tolerance or within tolerance. The like or dislike of product quality can be converted to a scale of how much do I like or dislike it.
Consideration of the cost of collecting variables versus attributes data should also be given when choosing the method. Typically the measuring instruments are more costly for performing variables measurements and the cost to organize, analyze and store variables data is higher as well. A go/no go ring gage can be used to quickly check outside diameter threads.To determine the actual pitch diameter is a slower and more costly process.
Variables data requires storing of individual values and computations for the mean, standard deviation, and other estimates of the population. Attributes data requires minimal counts of each category and hence requires very little data storage space.
For manual data collection, the required skill level of the technician is higher for variables data than for attribute data. Likewise, the cost of automated equipment for variables data is higher than for attributes data. The ultimate purpose for the data collection and the type of data are the most significant factors in the decision to collect attribute or variables data.
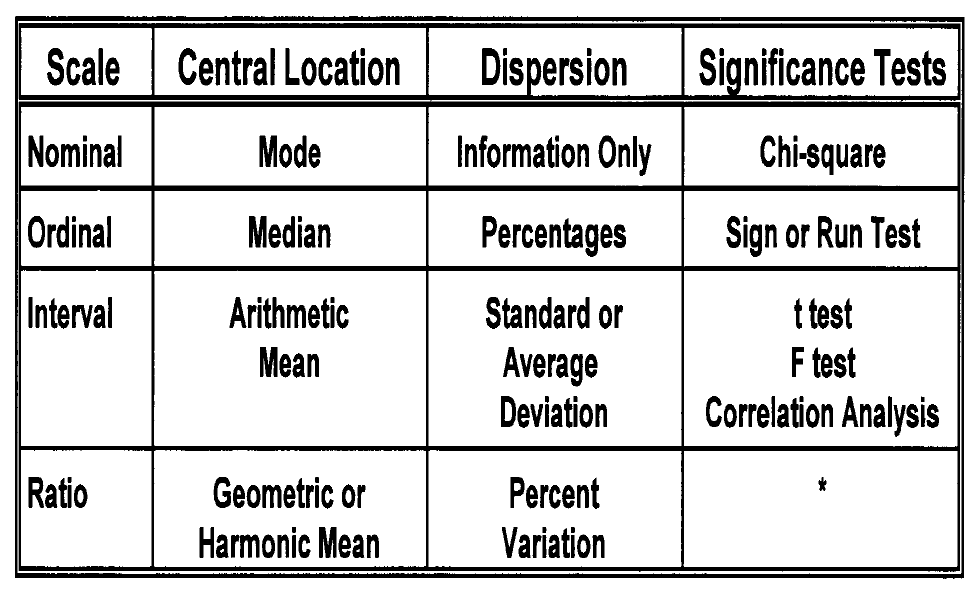
Measurement Scales
The following table details four measurement scales in increasing order od statistical desirability.
Nominal
Data consist of names or category only . No ordering scheme is possible.
Ordinal (Ranking)
Data is arranged in some order but difference between values cannot be determined or are meaningless
Interval
Data is arranged in order and difference can be found . However , there is no inherent starting point and ratios are meaningless.
Ratio
An extension of teh interval level that includes an inherent zero starting point. both difference and ratios are meaningful.
Arithmetic Mean: (AVERAGE OF ALL) The mean is the average of all numbers. Example: 100 watts, 98 watts, 105 watts, 90 watts and 102 watts of power, respectively. The mean is calculated as (100 + 98 + 105 + 90 + 102 W)/5 = 99 W
Median: (MIDDLE NUMBER) is the middle number in a sequence of numbers. To find the median, organize each number in order by size; the number in the middle is the median. Example 90 W, 98 W, 100 W, 102 W and 105 W. The median of the rack is 100 W.
Mode: (OFTEN NUMBER) The mode is the number that occurs most often within a set of numbers. Example: set of numbers is 90 W, 104 W, 98 W, 98 W, 105 W, 92 W, 102 W, 100 W, 110 W, 98 W, 210 W and 115 W. The mode is 98 W since that measurement occurs most often.
Geometric Mean or Harmonic Mean: ( ROOT OF MULTPLY NUMBER) It is the nth root of the product of n numbers. That means you multiply a bunch of numbers together, and then take the nth root, where n is the number of values you just multiplied. If you multiplied two numbers, you take the square root. If you multiplied three numbers you take the cubic root. Check here for more
Data Examples
Continuous and discrete data, measurement scales 1. Continuous data: A station wagon weighs 3478.6 lbs 2. Discrete data: On the last C55BB exam, 800 people failed 3. Ordinal scale: Defects are categorized as critical, major A, major B and minor 4. Nominal scale: A print-out of all shipping codes for last week’s orders 5. Ratio scale: The individual weights of a sample of widgets 6. Interval scale: The temperatures of steel rods (OF) after one hour of cooling
Collecting and Summarizing Data
Collecting and summarizing data is described in the following topics:
•Types of data
•Measurement scales
•Methods for collecting data
•Techniques for assuring data accuracy and integrity
•Descriptive statistics
•Graphical methods
Measurement Usage
Measurements can be made of the inputs to the process, the process itself, or the outputs of the process.
Why Measure?
•Measurement allows Teams to …
–Establish baseline process performance
–Isolate sources of variation
–Identify areas where improvements can be made
All Processes Have Variation
•All repetitive activities of a process have a certain amount of fluctuation
•Input, process, and output measures also fluctuate
•This fluctuation is called variation
Sources of Variation
Machines
Materials
Methods
Measurement
Mother Nature
People
Two Types of Variation
1. Common Causes: No undue influence by any one of the 5Ms and 1P
Characteristics : Expected Predictable Normal
2. Special cause : Undue influence by at least one of the 5Ms and 1P
Characteristics: Unexpected Unpredictable Not normal
Types of Data
Data is objective information that everyone can agree on. Measurability is important in collecting data. The three types of data are attribute data, variables data and locationaldata. Of these three, attribute and variables data are more widely used.
Attribute Data
Attribute data is discrete. This means that the data values can only be integers, for example, 3, 48, 1029. Counted data or attribute data are answers to questions like “how many”, “how often” or “what kind.” Examples include: . How many of the final products are defective? . How often are the machines repaired? . How many people are absent each day? . How many days did it rain last month? . What kind of performance was achieved?
Variables Data
Variables data is continuous. This means that the data values can be any real number, for example, 1.037, -4.69, 84.35. Measured data (variables data) are answers to questions like “how long,” “what volume,” “how much time” and “how far.” This data is generally measured with some instrument or device. Examples include: . How long is each item? . How long did it take to complete the task? . What is the weight of the product? Measured data is regarded as being better than counted data. It is more precise and contains more information. For example, one would certainly knowmuch more about the climate of an area if they knew how much it rained each day rather than how many days it rained. Collecting measured data is often difficult or expensive, so we must often rely on counted data. In some situations, data will only occur as counted data. For example, a food producer may measure the performance of microwave popcorn by counting thenumber of kernels of unpoppedcorn in each bag tested. For information which can be obtained as either attribute or variables data, it is generally preferable to collect variables data.
Examples of Data Types
•Attribute Data
–Categories
–Yes/No
–Go/No Go
–Pass/Fail
–Good/Defective
•Variable Data
–Continuous Data
•Decimal places show absolute distance between numbers
–Time
–Finance Charges
–Length
–Width
Locational Data
The third type of data, does not fit into either category above.This data is known as locationaldata which simply answers the question “where.” Charts that utilize locationaldata are often called “measles charts” or concentration charts. Examples are a drawing showing locations of paint blemishes on an automobile or a map of the United States with sales and distribution offices indicated.
Conversion of Attributes Data to Variables
Measures Some data may only have discrete values, such as this part is good or bad, or I like or dislike the quality of this product. Since variables data provides more information than does attributes data, for a given sample size, it is desirable to use variables data whenever possible.
When collecting data, there are opportunities for some types of data to be either attributes or variables. Instead of a good or bad part, the data can be statedas to how far out of tolerance or within tolerance. The like or dislike of product quality can be converted to a scale of how much do I like or dislike it.
Consideration of the cost of collecting variables versus attributes data should also be given when choosing the method. Typically the measuring instruments are more costly for performing variables measurements and the cost to organize, analyze and store variables data is higher as well. A go/no go ring gage can be used to quickly check outside diameter threads.To determine the actual pitch diameter is a slower and more costly process.
Variables data requires storing of individual values and computations for the mean, standard deviation, and other estimates of the population. Attributes data requires minimal counts of each category and hence requires very little data storage space.
For manual data collection, the required skill level of the technician is higher for variables data than for attribute data. Likewise, the cost of automated equipment for variables data is higher than for attributes data. The ultimate purpose for the data collection and the type of data are the most significant factors in the decision to collect attribute or variables data.
Measurement Scales
The following table details four measurement scales in increasing order od statistical desirability.
Nominal
Data consist of names or category only . No ordering scheme is possible.
Ordinal (Ranking)
Data is arranged in some order but difference between values cannot be determined or are meaningless
Interval
Data is arranged in order and difference can be found . However , there is no inherent starting point and ratios are meaningless.
Ratio
An extension of teh interval level that includes an inherent zero starting point. both difference and ratios are meaningful.
Arithmetic Mean: (AVERAGE OF ALL) The mean is the average of all numbers. Example: 100 watts, 98 watts, 105 watts, 90 watts and 102 watts of power, respectively. The mean is calculated as (100 + 98 + 105 + 90 + 102 W)/5 = 99 W
Median: (MIDDLE NUMBER) is the middle number in a sequence of numbers. To find the median, organize each number in order by size; the number in the middle is the median. Example 90 W, 98 W, 100 W, 102 W and 105 W. The median of the rack is 100 W.
Mode: (OFTEN NUMBER) The mode is the number that occurs most often within a set of numbers. Example: set of numbers is 90 W, 104 W, 98 W, 98 W, 105 W, 92 W, 102 W, 100 W, 110 W, 98 W, 210 W and 115 W. The mode is 98 W since that measurement occurs most often.
Geometric Mean or Harmonic Mean: ( ROOT OF MULTPLY NUMBER) It is the nth root of the product of n numbers. That means you multiply a bunch of numbers together, and then take the nth root, where n is the number of values you just multiplied. If you multiplied two numbers, you take the square root. If you multiplied three numbers you take the cubic root. Check here for more
Data Examples
Continuous and discrete data, measurement scales 1. Continuous data: A station wagon weighs 3478.6 lbs 2. Discrete data: On the last C55BB exam, 800 people failed 3. Ordinal scale: Defects are categorized as critical, major A, major B and minor 4. Nominal scale: A print-out of all shipping codes for last week’s orders 5. Ratio scale: The individual weights of a sample of widgets 6. Interval scale: The temperatures of steel rods (OF) after one hour of cooling