Six Sigma Analyze : 2 Hypothesis Testing
Null Hypothesis Test Statistic Type I error Type II error The degree of risk (α) One Tail Test vs. Two-Tail Test Required Sample Size One Sample t-Test Hypothesis Tests for Variance Chi-Square (X2) Chi-Square Case II. Paired t-Test F-test Comparing Observed and Expected Frequencies of Test Outcomes. (Attribute Data)
Null Hypothesis
This is the hypothesis to be tested. The null hypothesis directly stems from the problem statement and is denoted as Ho.
Examples
If we are investigating whether a modified seed will result ina different yield/acre, the null hypothesis ( 2 -tail) would assume the yields to be the same Ho: Ya= Y b. .
If a strong claim is made that the average of process A is greater than the average of process B, the null hypothesis (1 -tail) would state that process A process B. This is written as Ho: A ≤B.
Test Statistic
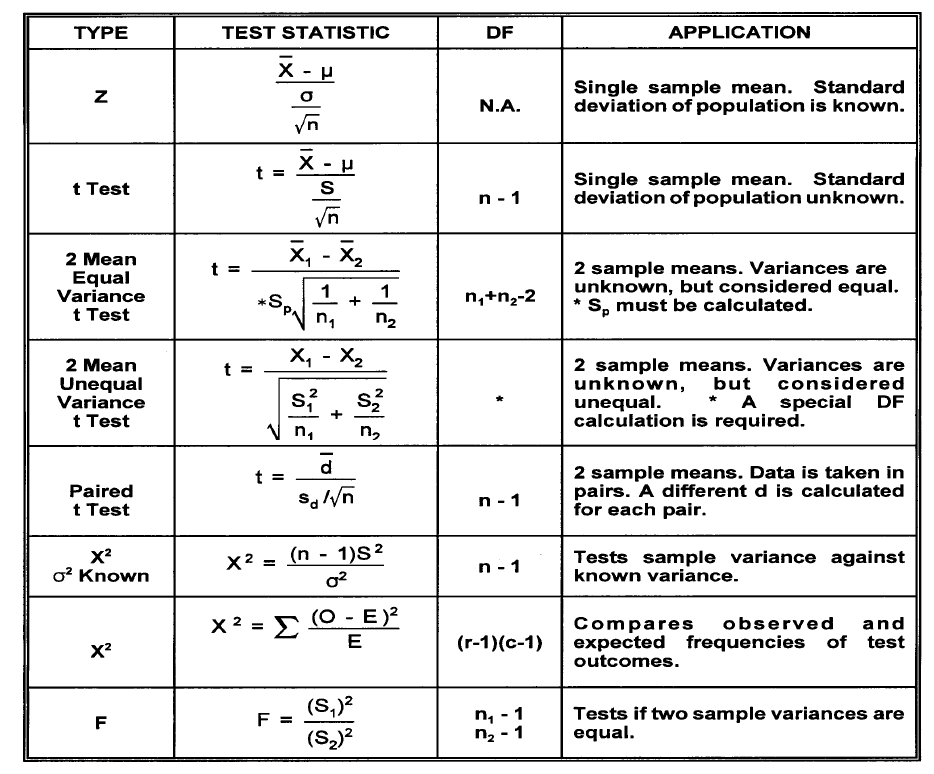
In order to test a null hypothesis, a test calculation must be made from sample information. This calculated value is called a test statistic and is compared to an appropriate critical value. A decision can then be made to reject or not reject the null hypothesis
Types of Errors
When formulating a conclusion regarding a population based on observations from a small sample, two types of errors are possible:
Type I error
This error results when the null hypothesis is rejected when it is, in fact, true. The probability of making a type I error is called α(alpha) and is commonly referred to as the producer’s risk (in sampling). Examples are: incoming products are good but called bad; a process change yields improvement but is thought to be no different.
Type II error
This error results when the null hypothesis is not rejected whenit should be rejected. This error is called the consumer’s risk (insampling) and is denoted by the symbolβ(beta). Examples are: incoming products are bad, but called good; an adverse process change has occurred but is thought to be no different.
The degree of risk (α) is normally chosen by the concerned parties (αis normally taken as 5%) in arriving at the critical value of the test statistic, the assumption is that a small value for αis desirable. Unfortunately, a small α risk increases the βrisk. For a fixed sample size, αand βare inversely related. Increasing the sample size can reduce both the αand βrisks.
One Tail Test vs. Two-Tail Test
Any test of hypothesis has a risk associated with it and we are generally concerned with the a risk (αtype I error which rejects the null hypothesis when it is true). The level of this a risk determines the level of confidence (1 -α) that we have in the conclusion. This risk factor is used to determine the critical value of the test statistic which is compared to a calculated value.
One Tail Test
If a null hypothesis is established to test whether a sample value is smaller or larger than a population value, then the entire α risk is placed on one end of a distribution curve. This constitutes a one tail test. .
A study was conducted to determine if the mean battery life produced by a new method is greater than the present battery life of 35 hours. In this case, the entire a risk will be placed on the right tail of the existing life distribution curve.
A chemist is studying the vitamin levels in a brand of cereal to determine if the process level has fallen below 20% of the minimum daily requirement. It is the manufacturer’s intent to never average below the 20% level. A one tail test would be applied in this case with the entire a risk on the left tail.
In statistical significance testing, a one-tailed test and a two-tailed test are alternative ways of computing the statistical significance of a parameter inferred from a data set, in terms of a test statistic. A two-tailed test is used if deviations of the estimated parameter in either direction from some benchmark value are considered theoretically possible; in contrast, a one-tailed test is used if only deviations in one direction are considered possible. Alternative names are one-sided and two-sided tests; the terminology “tail” is used because the extreme portions of distributions, where observations lead to rejection of the null hypothesis, are small and often “tail off” toward zero as in the normal distribution or “bell curve”, pictured above right.
Required Sample Size
In the statistical inference discussion thus far, it has been assumed that the sample size (n) for hypothesis testing has been given and that the critical value of the test statistic will be determined based on the a error that can be tolerated. The ideal procedure, however, is to determine the a and 13 error desired and then to calculate the sample size necessary to obtain the desired decision confidence. The sample size (n) needed for hypothesis testing depends on: •The desired type I (α) and type II (β) risk •The minimum value to be detected between the population means (μ-μo) •The variation in the characteristic being measured (S or σ)
One Sample t-Test
Z-test need population standard deviation, which is only feasible When you have large amount of history data. Most often, we only Have a random sample of data to work with. T-test will be good
for this.
Hypothesis Tests for Variance Chi-Square (X2)
Test We have seen earlier that standard deviation (or variance) is fundamental in making inferences regarding the population mean. In many practical situations, variance (σ2) assumes a position of greater importance than the population mean.
Consider the following examples:
1. A shoe manufacturer wishes to develop a new sole material with a more stable wear pattern. The wear variation in the new material must be smaller than the variation in the existing material.
2. An aircraft altimeter manufacturer wishes to compare the measurement precision among several instruments.
3. Several inspectors examine finished parts at the end of a manufacturing process. Even when the same lots are examined by different inspectors, the number of defectives varies. Their supervisor wants to know if there is a significant difference in the knowledge or abilities of the inspectors
All of the above problems represent a comparison of a target or population variance with an observed sample variance, a comparison between several sample variances, or a comparison between frequency proportions.
The standardized test statistic is called the chi-square (X2) test. Population variances are distributed according to the chi-square distribution.
Therefore, inferences about a single population variance will bebased on chi-square. The chi-square test is widely used in two applications.
Case I. Comparing variances when the variance of the population is known.
Case II. Comparing observed and expected frequencies of test outcomes when there is no defined population variance (attribute data).
Chi-Square Case II. Comparing Observed and Expected Frequencies of Test Outcomes. (Attribute Data)
It is often necessary to compare proportions representing various process conditions. Machines may be compared as to their ability to produce precise parts. The ability of inspectors to identify defective products can be evaluated. This application of chi-square is called the contingency table or row and column analysis. The procedure is as follows:
1.Take one subgroup from each of the various processes and determine the observed frequencies (0) for the various conditions being compared.
2. Calculate for each condition the expected frequencies (E) under the assumption that no differences exist among the processes.
Paired t-Test
When we do two sample t-test, we implicitly assume that μ1and μ2 are stable means. In some problems, μ1and μ2 are not same from sample to sample, but the difference d= μ1-μ2 has good meanings and we want to make inference on it.
F-test
F Test is any statistical test in which the test statistic has an F-distribution under the null hypothesis. It is most often used when comparing statistical models that have been fitted to a data set, in order to identify the model that best fits the population from which the data were sampled. Exact “F-tests” mainly arise when the models have been fitted to the data using least squares. The name was coined by George W. Snedecor, in honour of Sir Ronald A. Fisher. Fisher initially developed the statistic as the variance ratio in the 1920s.
Null Hypothesis
This is the hypothesis to be tested. The null hypothesis directly stems from the problem statement and is denoted as Ho.
Examples
If we are investigating whether a modified seed will result ina different yield/acre, the null hypothesis ( 2 -tail) would assume the yields to be the same Ho: Ya= Y b. .
If a strong claim is made that the average of process A is greater than the average of process B, the null hypothesis (1 -tail) would state that process A process B. This is written as Ho: A ≤B.
Test Statistic
In order to test a null hypothesis, a test calculation must be made from sample information. This calculated value is called a test statistic and is compared to an appropriate critical value. A decision can then be made to reject or not reject the null hypothesis
Types of Errors
When formulating a conclusion regarding a population based on observations from a small sample, two types of errors are possible:
Type I error
This error results when the null hypothesis is rejected when it is, in fact, true. The probability of making a type I error is called α(alpha) and is commonly referred to as the producer’s risk (in sampling). Examples are: incoming products are good but called bad; a process change yields improvement but is thought to be no different.
Type II error
This error results when the null hypothesis is not rejected whenit should be rejected. This error is called the consumer’s risk (insampling) and is denoted by the symbolβ(beta). Examples are: incoming products are bad, but called good; an adverse process change has occurred but is thought to be no different.
The degree of risk (α) is normally chosen by the concerned parties (αis normally taken as 5%) in arriving at the critical value of the test statistic, the assumption is that a small value for αis desirable. Unfortunately, a small α risk increases the βrisk. For a fixed sample size, αand βare inversely related. Increasing the sample size can reduce both the αand βrisks.
One Tail Test vs. Two-Tail Test
Any test of hypothesis has a risk associated with it and we are generally concerned with the a risk (αtype I error which rejects the null hypothesis when it is true). The level of this a risk determines the level of confidence (1 -α) that we have in the conclusion. This risk factor is used to determine the critical value of the test statistic which is compared to a calculated value.
One Tail Test
If a null hypothesis is established to test whether a sample value is smaller or larger than a population value, then the entire α risk is placed on one end of a distribution curve. This constitutes a one tail test. .
A study was conducted to determine if the mean battery life produced by a new method is greater than the present battery life of 35 hours. In this case, the entire a risk will be placed on the right tail of the existing life distribution curve.
A chemist is studying the vitamin levels in a brand of cereal to determine if the process level has fallen below 20% of the minimum daily requirement. It is the manufacturer’s intent to never average below the 20% level. A one tail test would be applied in this case with the entire a risk on the left tail.
In statistical significance testing, a one-tailed test and a two-tailed test are alternative ways of computing the statistical significance of a parameter inferred from a data set, in terms of a test statistic. A two-tailed test is used if deviations of the estimated parameter in either direction from some benchmark value are considered theoretically possible; in contrast, a one-tailed test is used if only deviations in one direction are considered possible. Alternative names are one-sided and two-sided tests; the terminology “tail” is used because the extreme portions of distributions, where observations lead to rejection of the null hypothesis, are small and often “tail off” toward zero as in the normal distribution or “bell curve”, pictured above right.
Required Sample Size
In the statistical inference discussion thus far, it has been assumed that the sample size (n) for hypothesis testing has been given and that the critical value of the test statistic will be determined based on the a error that can be tolerated. The ideal procedure, however, is to determine the a and 13 error desired and then to calculate the sample size necessary to obtain the desired decision confidence. The sample size (n) needed for hypothesis testing depends on: •The desired type I (α) and type II (β) risk •The minimum value to be detected between the population means (μ-μo) •The variation in the characteristic being measured (S or σ)
One Sample t-Test
Z-test need population standard deviation, which is only feasible When you have large amount of history data. Most often, we only Have a random sample of data to work with. T-test will be good
for this.
Hypothesis Tests for Variance Chi-Square (X2)
Test We have seen earlier that standard deviation (or variance) is fundamental in making inferences regarding the population mean. In many practical situations, variance (σ2) assumes a position of greater importance than the population mean.
Consider the following examples:
1. A shoe manufacturer wishes to develop a new sole material with a more stable wear pattern. The wear variation in the new material must be smaller than the variation in the existing material.
2. An aircraft altimeter manufacturer wishes to compare the measurement precision among several instruments.
3. Several inspectors examine finished parts at the end of a manufacturing process. Even when the same lots are examined by different inspectors, the number of defectives varies. Their supervisor wants to know if there is a significant difference in the knowledge or abilities of the inspectors
All of the above problems represent a comparison of a target or population variance with an observed sample variance, a comparison between several sample variances, or a comparison between frequency proportions.
The standardized test statistic is called the chi-square (X2) test. Population variances are distributed according to the chi-square distribution.
Therefore, inferences about a single population variance will bebased on chi-square. The chi-square test is widely used in two applications.
Case I. Comparing variances when the variance of the population is known.
Case II. Comparing observed and expected frequencies of test outcomes when there is no defined population variance (attribute data).
Chi-Square Case II. Comparing Observed and Expected Frequencies of Test Outcomes. (Attribute Data)
It is often necessary to compare proportions representing various process conditions. Machines may be compared as to their ability to produce precise parts. The ability of inspectors to identify defective products can be evaluated. This application of chi-square is called the contingency table or row and column analysis. The procedure is as follows:
1.Take one subgroup from each of the various processes and determine the observed frequencies (0) for the various conditions being compared.
2. Calculate for each condition the expected frequencies (E) under the assumption that no differences exist among the processes.
Paired t-Test
When we do two sample t-test, we implicitly assume that μ1and μ2 are stable means. In some problems, μ1and μ2 are not same from sample to sample, but the difference d= μ1-μ2 has good meanings and we want to make inference on it.
F-test
F Test is any statistical test in which the test statistic has an F-distribution under the null hypothesis. It is most often used when comparing statistical models that have been fitted to a data set, in order to identify the model that best fits the population from which the data were sampled. Exact “F-tests” mainly arise when the models have been fitted to the data using least squares. The name was coined by George W. Snedecor, in honour of Sir Ronald A. Fisher. Fisher initially developed the statistic as the variance ratio in the 1920s.